Institutional Insights: UBS CTAs' Positioning and Flows - Biweekly Update

Global Strategy
CTAs' Positioning and Flows - Biweekly Update
Details on the methodology/model are available in our Q-Series report
Entering 2026 in Risk-On Mode
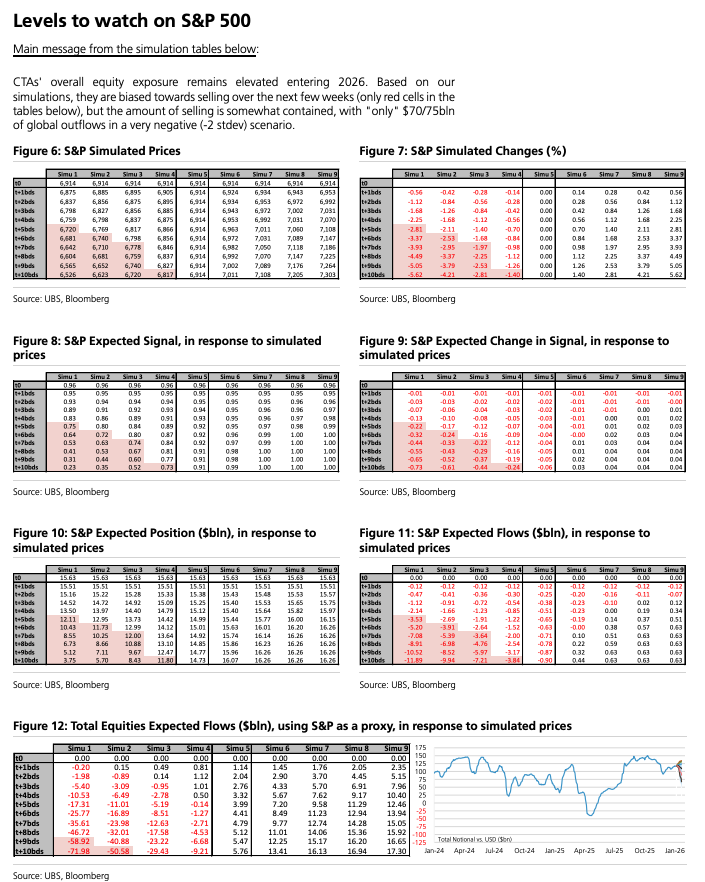
- Equities: CTAs' overall equity exposure remains elevated at the 88th percentile as we enter 2026. Forward-looking simulations suggest a bias towards near-term selling, but the scale is expected to be "contained," with potential outflows of $70-75 billion in a highly negative (-2 standard deviation) scenario. CTAs are likely to maintain a "bullishly patient" stance.
- Rates: CTAs have exited their relative value positions, selling the long leg (US & Canada) while holding the short leg (EU, Japan & Australia). Their aggregated positioning is now deeply short, and we do not foresee any imminent reversals. In fact, more scenarios suggest an increase in short positions.
- Credit: Low implied and realized volatilities, low default rates, and elevated government yields continue to support credit spreads. CTAs are at maximum long positioning in this asset class and are expected to maintain this stance in the near term.
- FX: December saw significant CTA activity, with over $200 billion in USD selling since the last update. G10 currencies captured most of these flows but now face risks of short-term reversals. We anticipate substantial selling in the EUR and CHF, larger than usual.
- Commodities: CTAs hold very long positions in precious and industrial metals, while maintaining very short positions in agricultural and energy commodities. Aside from some short covering in energy, minimal CTA activity is expected in the coming weeks.
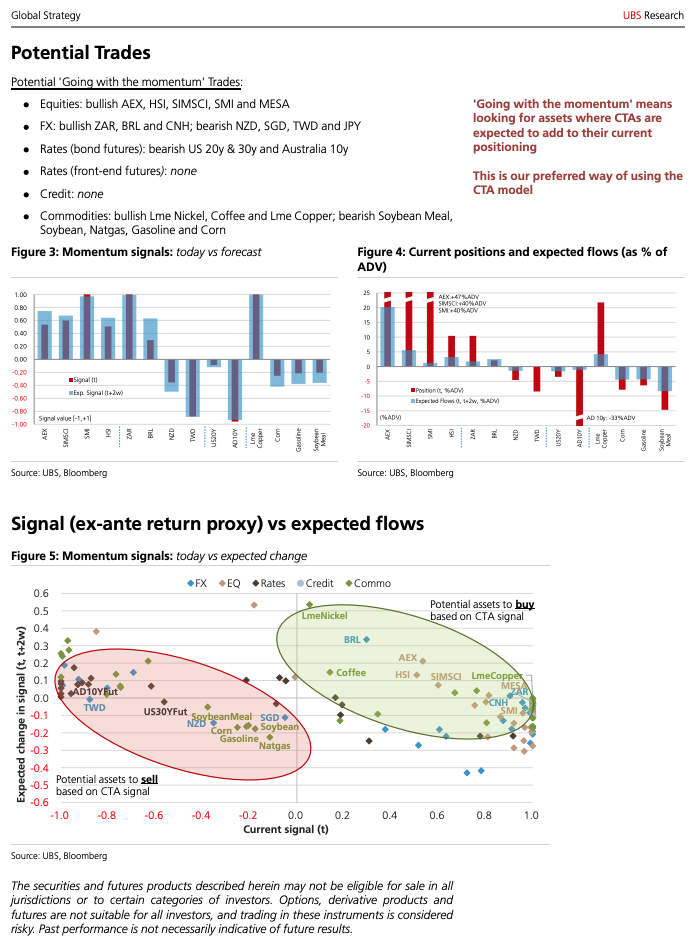
Current Signals: Bullish Stocks, Credit, Metals; Bearish USD, Bonds, Oil
a) Equities: Bullish across the board
b) Bonds: Bullish UK; Neutral US; Bearish elsewhere
c) Credit: Bullish across the board
d) Currencies: Bullish EMEA, CEE, and Latam FX; Bearish USD and Asia FX
e) Commodities: Bullish metals; Bearish energy and agriculturals
Disclaimer: The material provided is for information purposes only and should not be considered as investment advice. The views, information, or opinions expressed in the text belong solely to the author, and not to the author’s employer, organization, committee or other group or individual or company.
Past performance is not indicative of future results.
High Risk Warning: CFDs are complex instruments and come with a high risk of losing money rapidly due to leverage. 69% and 73% of retail investor accounts lose money when trading CFDs with Tickmill UK Ltd and Tickmill Europe Ltd respectively. You should consider whether you understand how CFDs work and whether you can afford to take the high risk of losing your money.
Futures and Options: Trading futures and options on margin carries a high degree of risk and may result in losses exceeding your initial investment. These products are not suitable for all investors. Ensure you fully understand the risks and take appropriate care to manage your risk.
Patrick has been involved in the financial markets for well over a decade as a self-educated professional trader and money manager. Flitting between the roles of market commentator, analyst and mentor, Patrick has improved the technical skills and psychological stance of literally hundreds of traders – coaching them to become savvy market operators!